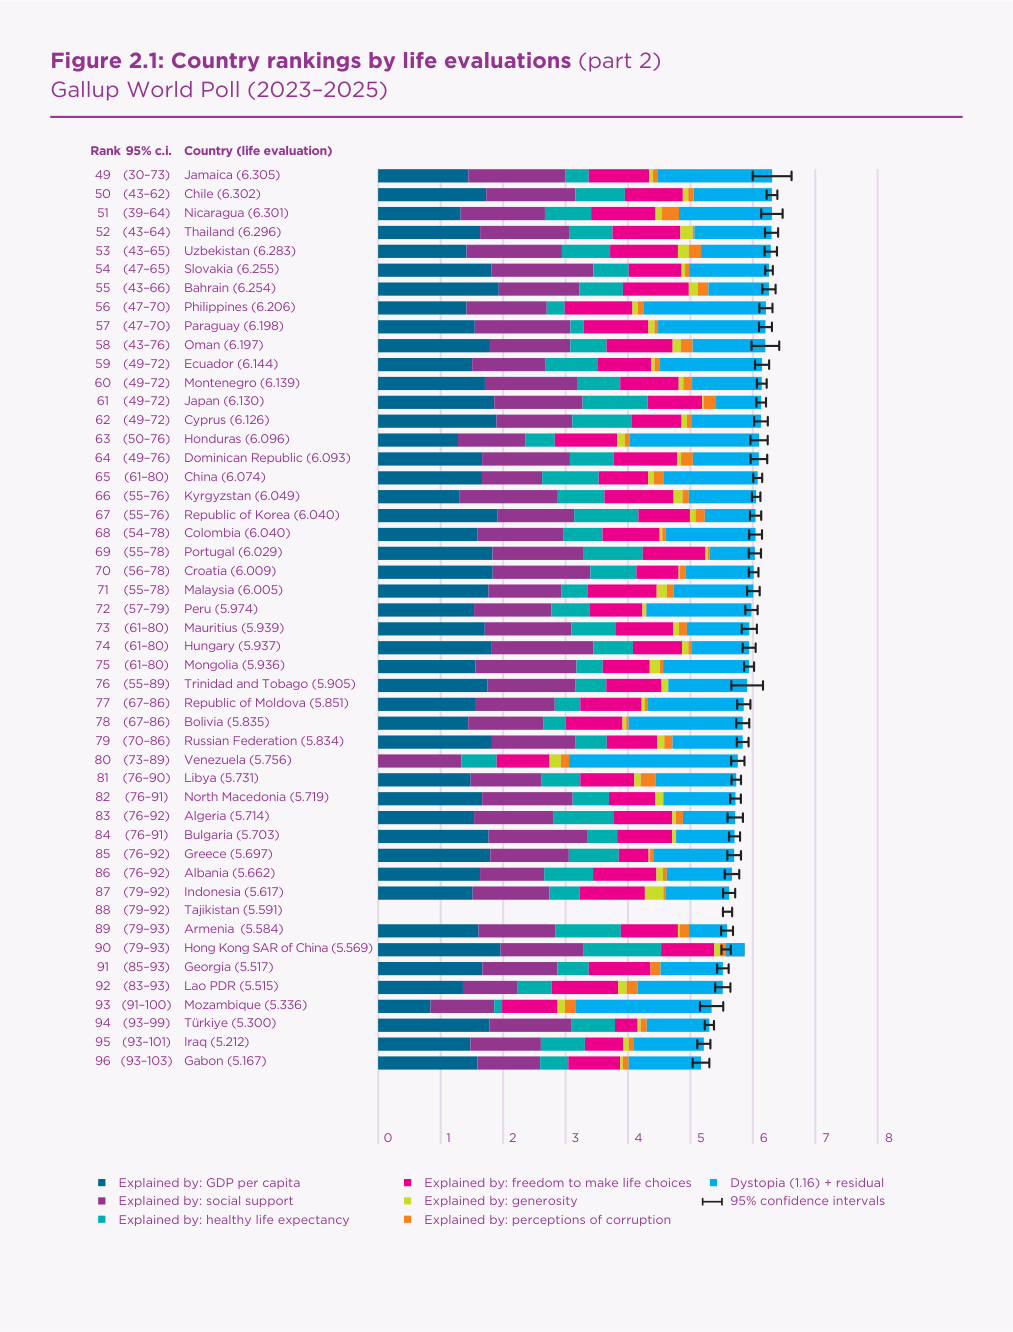
Figure 2.1 of the World Happiness Report 2026 (Helliwell
et al., 2026, pp. 21–23) ranks 147 countries by their
average answer to the Cantril ladder question, from 0 (worst possible
life) to 10 (best), using Gallup World Poll data for 2023–2025
(Figure 1). Each country is a horizontal bar labelled with its rank,
95% rank range and score. The bar is split into seven coloured
segments: six are the contributions a regression attributes to GDP per
capita, social support, healthy life expectancy, freedom, generosity
and perceived corruption, measured from “Dystopia”, an
imaginary country with the world’s lowest value of every factor;
the seventh is “Dystopia (1.16) + residual”.
The figure shows where each country stands, that the ranking is
uneven (a crowded top, a long bottom tail, uncertain mid-table ranks),
and that six measurable factors explain much of the gap. Its main audience is journalists, policymakers and the
public looking up their own country. Readers should be able to
look up a country (T1), judge whether a gap is real (T2), see the
distribution (T3), compare one factor across countries (T4), read one
country’s profile (T5) and find over- and under-performers
(T6).
Figure 1. The original Figure 2.1, part 2
of 3 (ranks 49–96), World Happiness Report 2026,
p. 22. Source: Helliwell et al. (2026).
2. Critique
Strengths. The rows are sorted and print the exact
rank, rank range and score, so lookup (T1) is precise.
And every bar starts at zero on a labelled axis, so total length
faithfully encodes the score.
Weaknesses.
W1. Stacking defeats comparison. Only the first
segment shares a baseline. The others require comparing unaligned
lengths, one of the least accurate perceptual tasks (Cleveland
& McGill, 1984), so T4 and T5, the purpose of the decomposition,
are effectively impossible.
W2. The loudest segment is a constant plus an error term,
and it breaks the bar. The saturated cyan segment is the
longest for 38 countries. Because a stack cannot go below zero, a
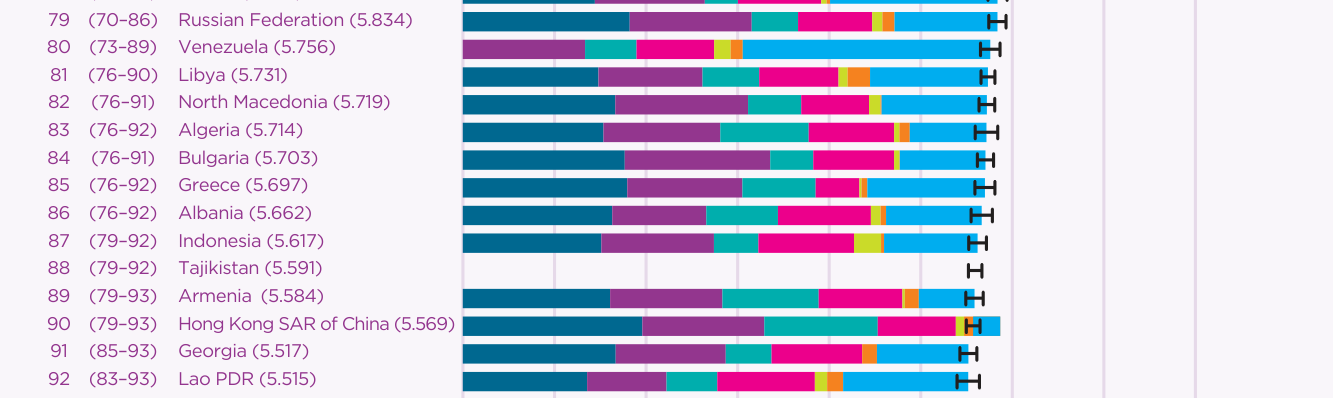
residual below −1.16 makes the bar overshoot: Hong
Kong’s reaches 5.87 although its score is 5.57
(Figure 2).
W3. The zero point is abstract and fragile.
Dystopia’s GDP comes from Venezuela, listed in the Statistical
Appendix at $89 per person (Yemen, next lowest, is at $917). Every
GDP segment is measured from that value, and Venezuela gets the
world’s largest residual.
W4. Gaps and uncertainty are hidden. Tajikistan and
Palestine get empty rows although each lacks only one factor. Rank
ranges are bracketed text, so the report’s own point that
mid-table ranges span 20–44 places is invisible, and the list
is split across three pages.
Figure 2. Ranks 79–92 of the original,
enlarged. Venezuela has no GDP segment (W3), Tajikistan’s row is
empty (W4), and Hong Kong’s bar runs past its own confidence
whisker (W2).
3. Redesign rationale
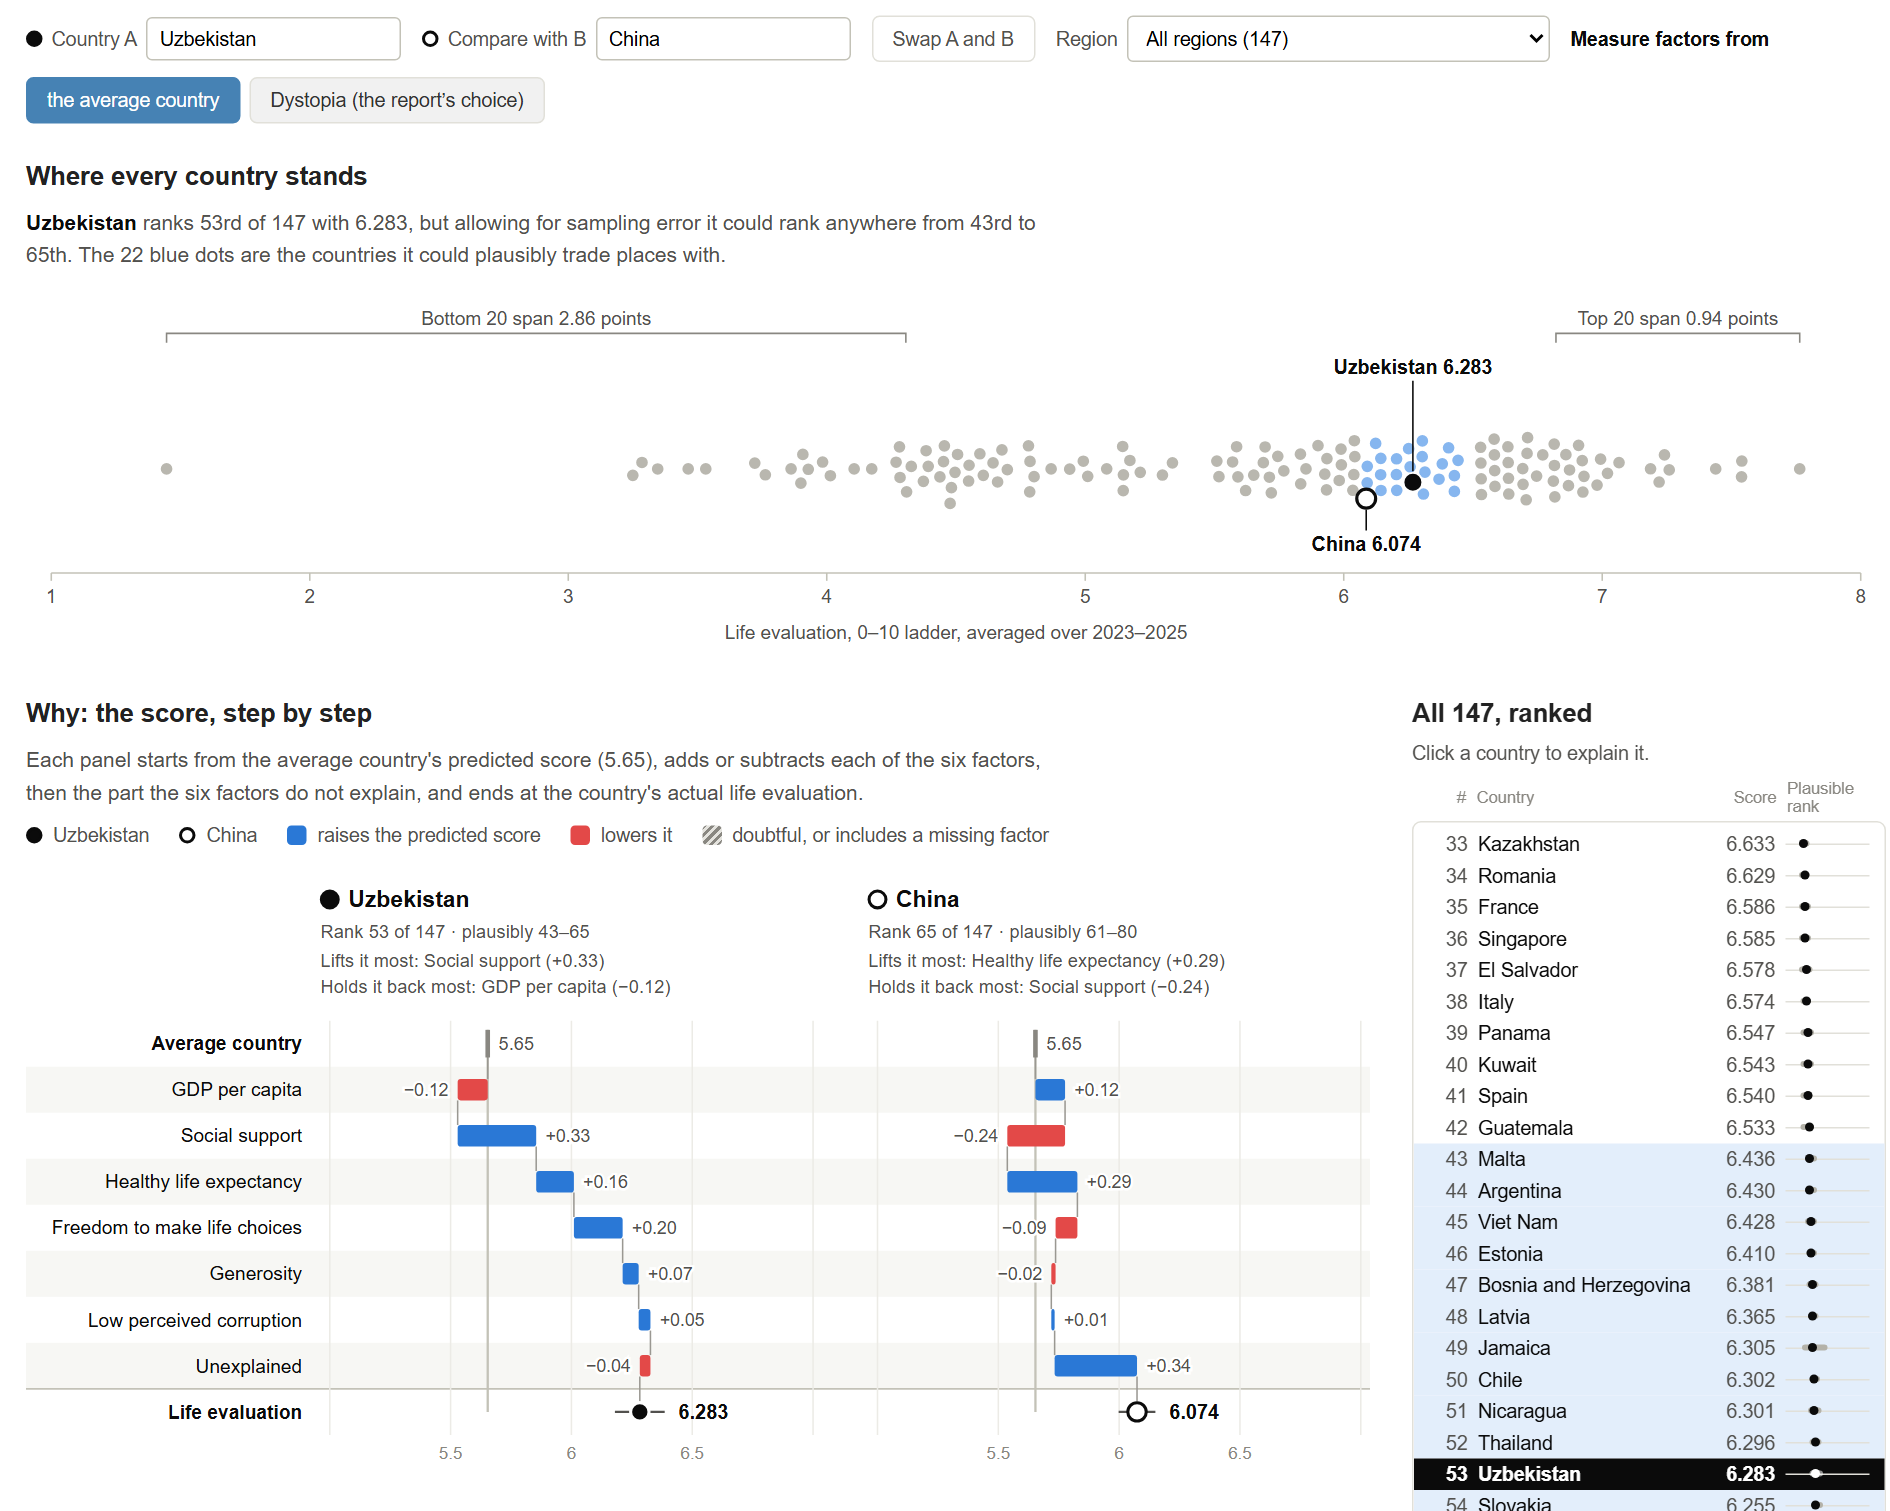
The redesign uses the report’s own data in four linked views;
clicking a country in any view selects it (Figure 3).
D1. A waterfall from the average country (W2, W3; T5,
T6). A country’s pieces become steps on separate rows,
running from the average country’s predicted score (5.65) to the
actual score: blue where a factor raises the prediction, red where it
lowers it, and the residual as the final step. A waterfall keeps the
stack’s one real virtue, parts that add up to the whole, while
allowing negative parts. The average country is a benchmark readers
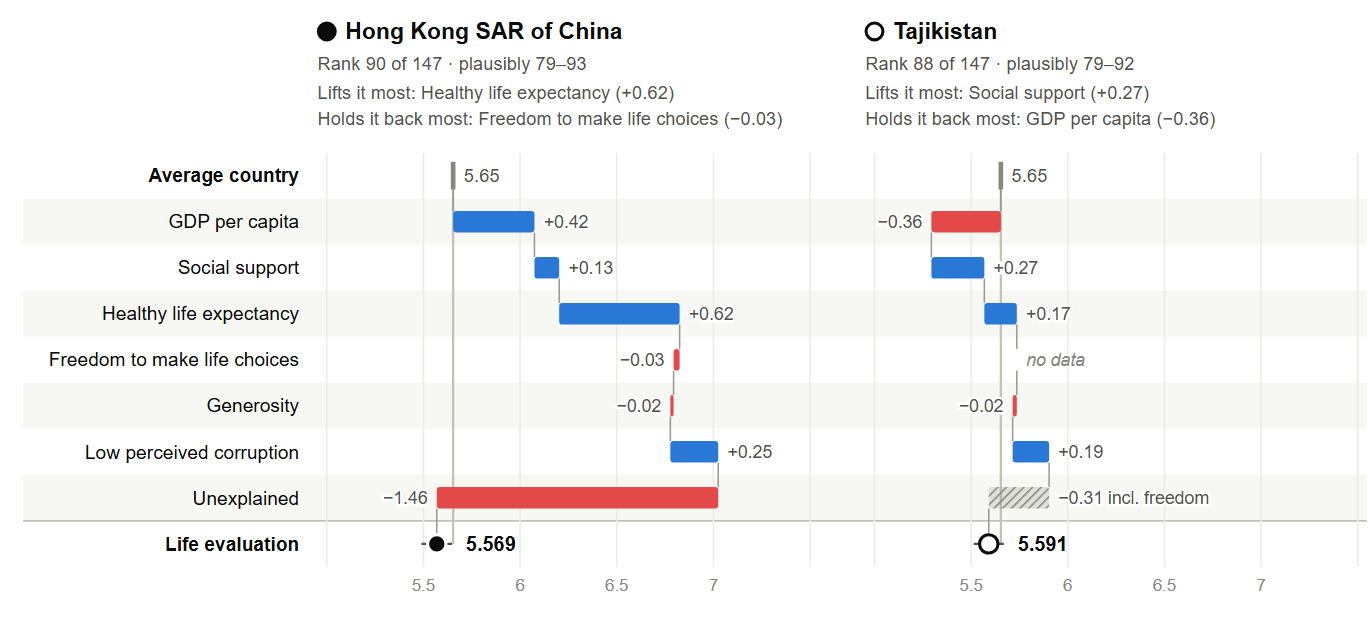
understand and, unlike Dystopia, it ignores the $89 value. Hong Kong’s factors
now climb to 7.03 before the unexplained step visibly drops it to 5.57
(Figure 4). A toggle restores the report’s baseline.
Figure 3. The redesign, with Uzbekistan as
country A and China as B: the controls, the beeswarm overview (the
countries Uzbekistan could plausibly trade places with are blue), the
two waterfalls and the ranked list.Figure 4. Hong Kong’s unexplained drop,
which the original drew as an overshoot, and Tajikistan’s missing
freedom factor, shown as “no data” and absorbed by a hatched
final step.
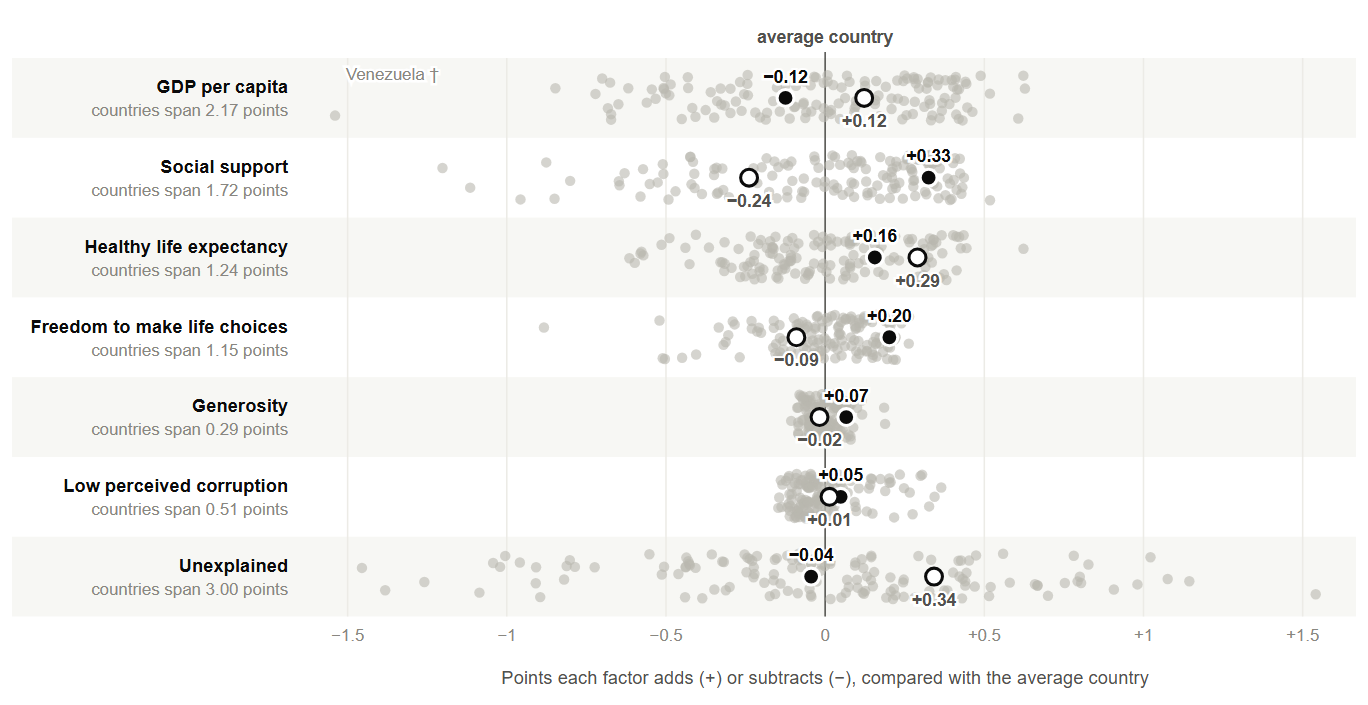
D2. Strip plots on one shared scale (W1; T4, T6). Each
factor gets its own axis with all 147 countries, so comparisons use
aligned position. The shared scale also shows how much each factor
matters: GDP spans 2.2 points, but generosity spans only 0.3
(Figure 5).
D3. Uncertainty as a group, distribution as a shape (W4; T2,
T3). A beeswarm puts every score on one axis and measures the
spread of the top and bottom 20; the countries inside the selected
country’s rank range turn blue.
D4. Honest gaps and one navigable list (W1, W4; T1).
Missing factors say “no data” and their effect becomes a
hatched final step; doubtful values are hatched and footnoted. One ranked list with search and a region filter replaces the
three pages, and colour encodes only direction.
Figure 5. Every country on each factor, on one
shared scale in ladder points relative to the average country.
Uzbekistan is the filled dot and China the ring.
4. Original versus redesign
Tasks the original blocked are now direct. Comparing Uzbekistan (6.28)
with China (6.07) shows why one outranks the other: social support adds
0.33 for Uzbekistan and subtracts 0.24 for China. Outliers, rank
uncertainty and regional comparison each take one click, and lookup is
as easy as before.
The costs: only two countries are explained at a time, where the
original shows all 147 at once. Waterfall steps float between panels,
so their values are printed. Measuring from the average departs from
the report’s numbers. The design also needs a screen, and the decomposition
stays correlational, not causal.
References
Bostock, M. (2026). D3.js (Version 7) [Computer software].
https://d3js.org
Cleveland, W. S., & McGill, R. (1984). Graphical perception:
Theory, experimentation, and application to the development of
graphical methods. Journal of the American Statistical Association,
79(387), 531–554.
https://doi.org/10.1080/01621459.1984.10478080
Helliwell, J. F., Aknin, L. B., Huang, H., Rojas, M., Wang, S., Guerra,
V., & Danyluk, A. (2026). Statistical appendix for
“International evidence on happiness and social media,”
Chapter 2 of World Happiness Report 2026.
https://files.worldhappiness.report/WHR26_Statistical_Appendix.pdf
Helliwell, J. F., Layard, R., Sachs, J. D., De Neve, J.-E., Aknin, L. B.,
& Wang, S. (Eds.). (2026). World happiness report 2026.
Wellbeing Research Centre, University of Oxford.
https://files.worldhappiness.report/WHR26.pdf