Every March, the headline “Finland is the happiest country in the
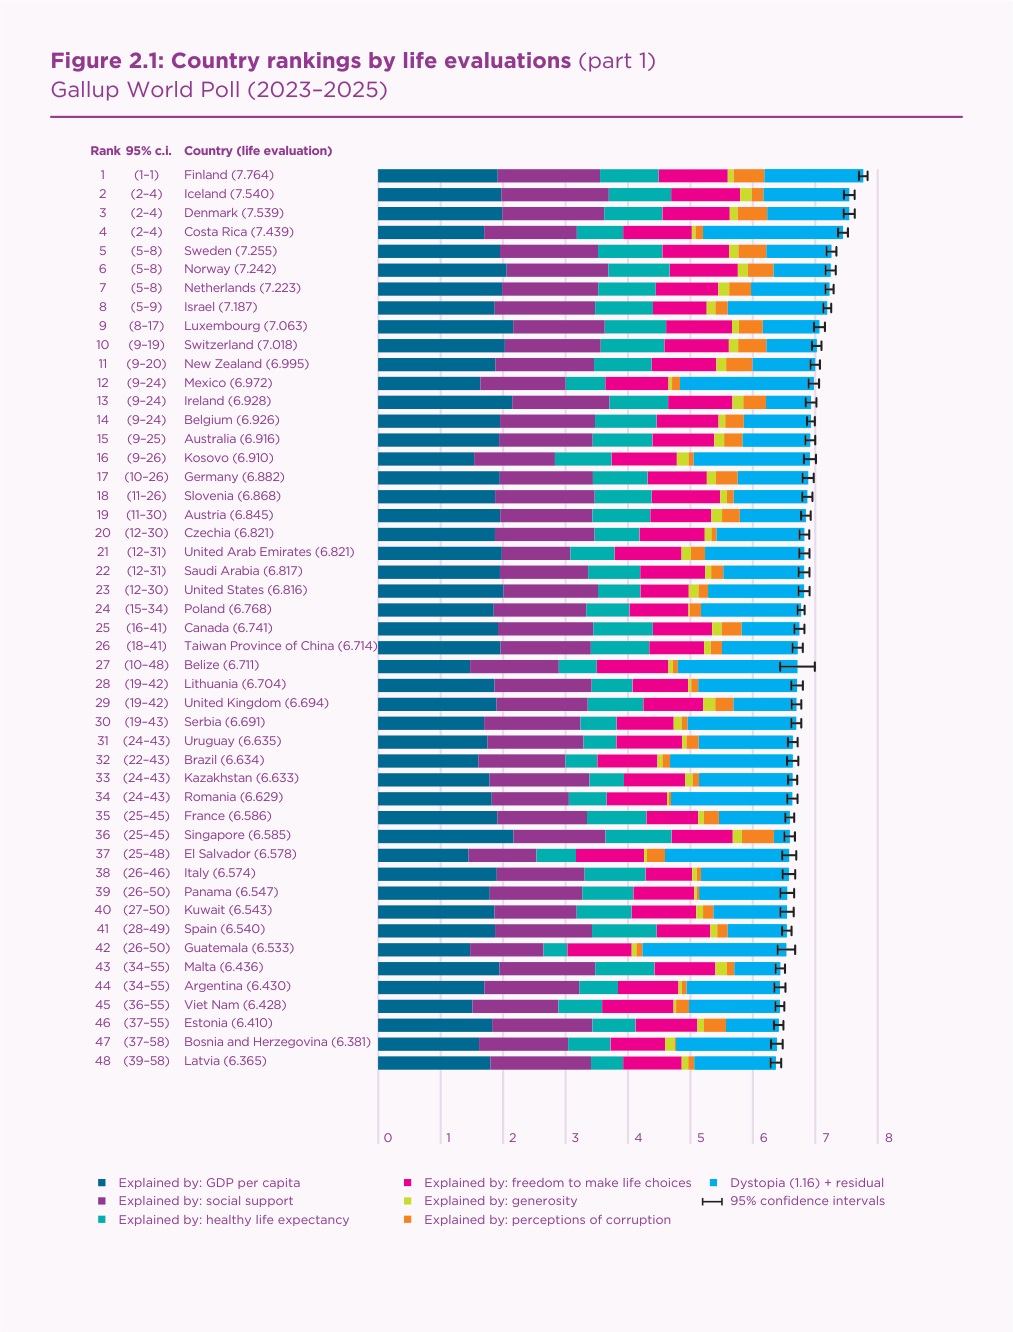
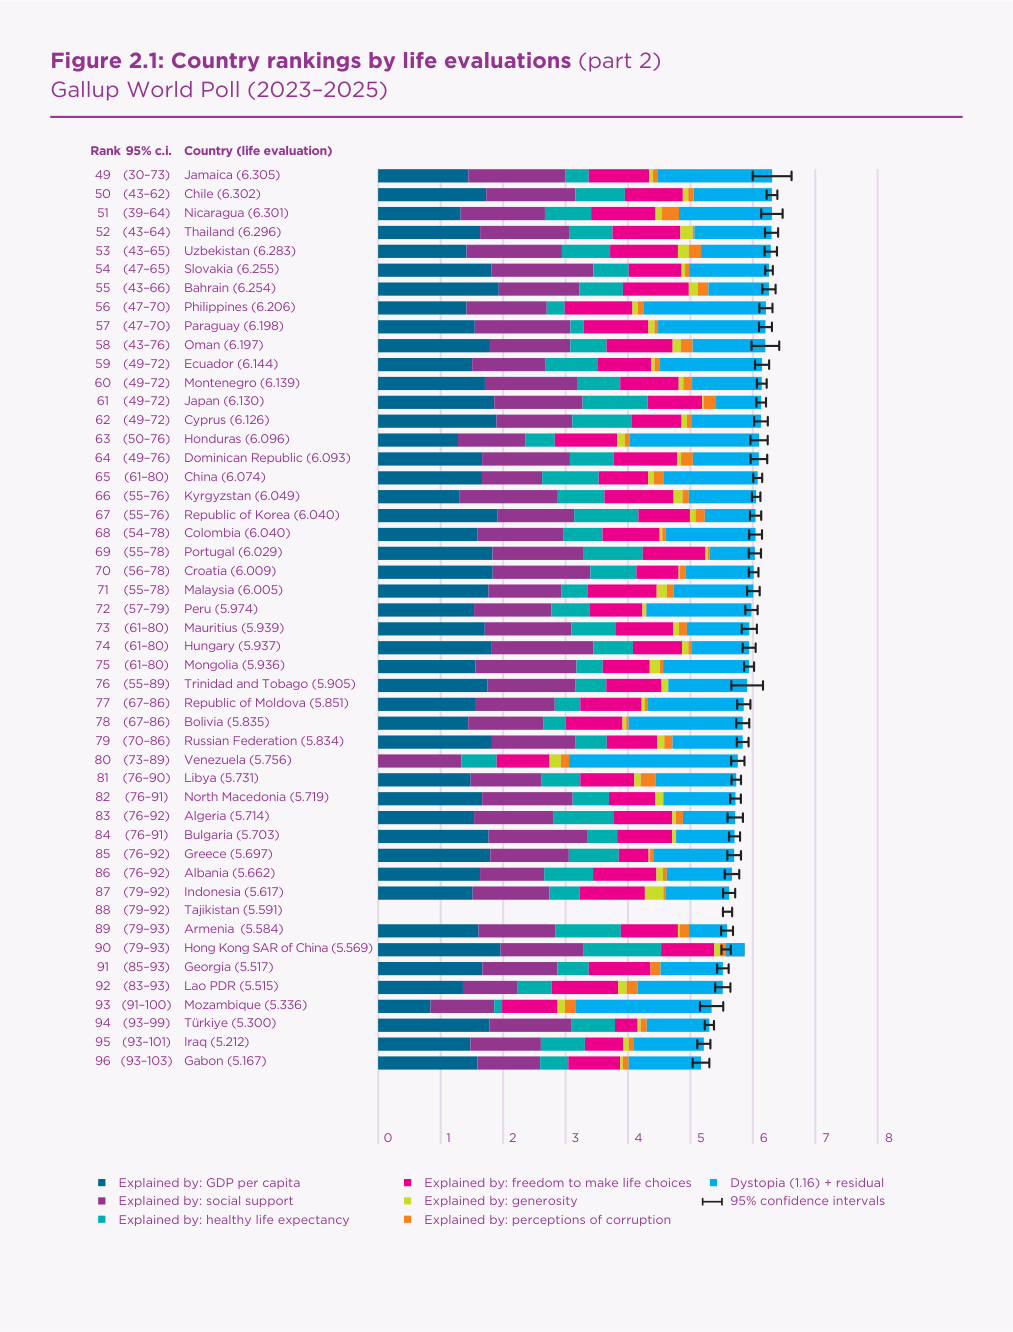
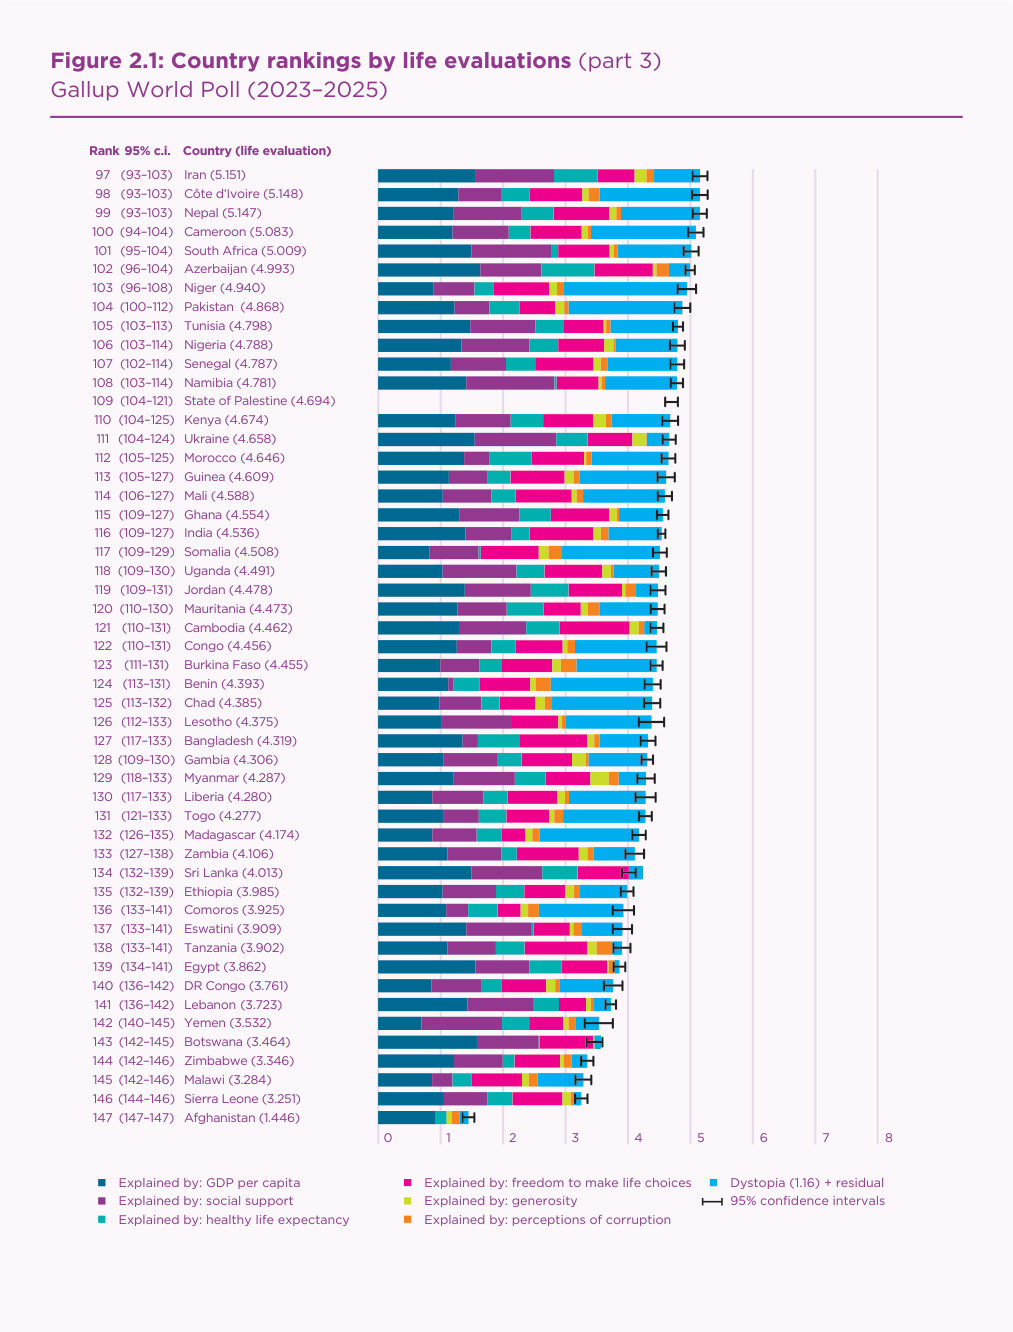
world” is written from one chart: Figure 2.1 of the
World Happiness Report 2026. It ranks 147 countries by how their
residents rate their own lives, then splits each score into the parts that
six factors (income, social support, health, freedom, generosity and
corruption) explain. Below are the original chart and an interactive D3
redesign built from the report’s own published data.
The critique of the original and the reasoning behind each design decision
are in the separate
critique and redesign report
(PDF).
1. The original visualization
Title
Figure 2.1: Country rankings by life evaluations (parts 1–3),
Gallup World Poll (2023–2025)
Source
World Happiness Report 2026, Chapter 2,
pp. 21–23. J. F. Helliwell, R. Layard,
J. D. Sachs, J.-E. De Neve, L. B. Aknin
and S. Wang (eds.), Wellbeing Research Centre, University of
Oxford, March 2026.
147 countries and territories. For each one: the average answer to
the Cantril ladder question (“imagine a ladder from 0, the worst
possible life for you, to 10, the best possible life”) in the
Gallup World Poll, pooled over 2023–2025 at roughly 1,000
respondents per country per year; a 95% confidence interval for that
average; and a 95% range for the country’s rank. Each score is
then split into seven stacked sub-bars: the part a regression
attributes to each of six factors (log GDP per capita, social support,
healthy life expectancy, freedom to make life choices, generosity,
perceptions of corruption), measured from Dystopia, an
imaginary country with the world’s lowest value of every factor
and a ladder score of 1.16, plus a final “Dystopia + residual”
sub-bar for whatever is left.
The original, as printed across three pages of the report (screenshots
rendered from the PDF by build_data.py).
Click a page to open it at full size.
2. The redesign
Four linked views replace the three pages of stacked bars. The overview
shows where every country stands. A waterfall explains one country’s
score step by step, and a second country can be placed beside it. Strip
plots compare every country on each factor, and a ranked list is used for
looking countries up. Click a country in any view to make it
country A. Every value comes from
redesign_whr2026.csv, which
build_data.py builds from the report’s own
spreadsheet.
Measure factors from
Where every country stands
Loading the rankings…
Why: the score, step by step
Loading the waterfall…
Each factor, across all 147 countries
One dot per country, all on the same scale of ladder points, so a
wider cloud means the factor separates countries more. A is the
filled dot and B the ring. Hover over a dot for its value and click
to make that country A.
Loading the factors…
Notes. † Venezuela’s GDP per capita is
listed at $89 in the Statistical Appendix, against $917 for Yemen, the next
lowest. Its GDP step and its large residual are hatched because both rest on
that value. When a factor has no data, as for Tajikistan (freedom) and the
State of Palestine (healthy life expectancy), the other five are still
drawn. The missing factor’s effect then sits inside the final step,
which is hatched grey. The report leaves these two rows blank. Rank ranges
are transcribed from the printed figure, because the spreadsheet does not
include them. Regions are the report’s own ten-region grouping from
the WHR 2021 data, with five newer countries assigned by hand.
Show all 147 countries as a table (the report’s own values)
3. Data sources and references
Helliwell, J. F., Layard, R., Sachs, J. D., De Neve, J.-E., Aknin, L. B.,
& Wang, S. (Eds.). (2026). World Happiness Report 2026.
Wellbeing Research Centre, University of Oxford.
PDF
— the original Figure 2.1, pp. 21–23.
World Happiness Report. (2026). Data for Figure 2.1 [Data set]:
WHR26_Data_Figure_2.1.xlsx
— scores, confidence intervals and the six factor contributions.
Helliwell, J. F., Aknin, L. B., Huang, H., Rojas, M., Wang, S., Guerra, V.,
& Danyluk, A. (2026). Statistical Appendix for Chapter 2 of World
Happiness Report 2026:
PDF
— missing-data rules (Section 3) and Venezuela’s GDP value
(Figure 24).
World Happiness Report. (2021). Data for Figure 2.1 [Data set]:
WHR21_Data_Figure_2.1.xls
— the report’s ten-region grouping.
Cleveland, W. S., & McGill, R. (1984). Graphical perception: Theory,
experimentation, and application to the development of graphical methods.
Journal of the American Statistical Association, 79(387), 531–554.
Bostock, M. (2011–2026). D3.js (version 7)
[Software]. d3js.org
Processed data for this page:
redesign_whr2026.csv, built by
build_data.py, which also reads the rank
ranges from the printed figure and renders the screenshots above.